How much warming can we tackle through methane?
This greenhouse gas is more than just a bit player in climate change.
Greenhouse gases are accumulating in the atmosphere every year, due burning fossil fuels for energy and transportation, creating a blanket over Earth that traps heat. The concentrations of carbon dioxide (CO2) in the atmosphere are rising faster and causing more warming than methane (CH4). But does this make methane unimportant?
Methane is the second most important greenhouse gas. There’s less of it in the atmosphere, but each molecule causes >80 times more warming than a molecule of CO2 in the immediate term. It then dissipates from the atmosphere at it is oxidized by atmospheric chemistry and some is absorbed into soils.
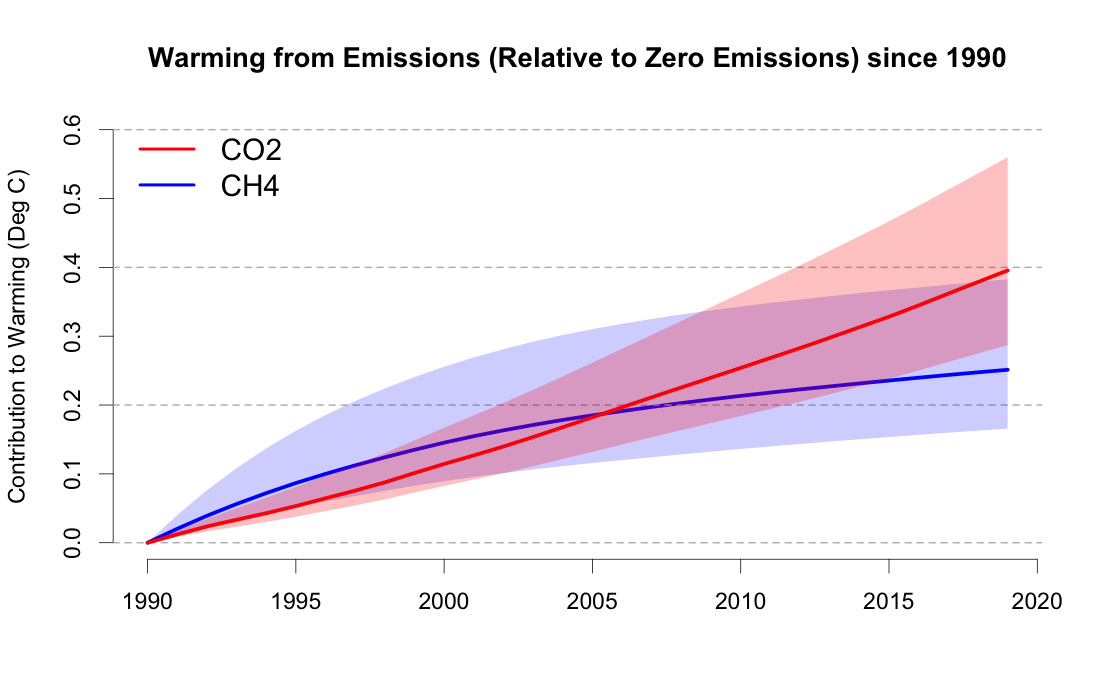
I created a graph showing how much additional warming our recent emissions have caused since 1990, relative to a scenario where we immediately ceased those emissions globally in 1990. It uses recent IPCC AR6 findings data-scraped onto github by climate scientist Chris Smith.
The temperature effects our emissions of methane and CO2 are comparable to one another, within their respective uncertainty.
The inspiration for this graph was a recent post by climate scientist Zeke Hausfather on twitter. Zeke asserts that methane is not (or far less) important because methane concentrations, and their warming, have only increased slightly since 1990, compared to CO2.
There is a lot of concern today about accelerating atmospheric CH4 concentrations, and we need to do a lot more to both understand why they are rising and reduce CH4 emissions.
— Zeke Hausfather (@hausfath) August 23, 2022
But let's not take our eye off the ball: CO2 is still the primary driver of warming in recent years! pic.twitter.com/32xLsPlArI
He used the same data that I did. So how did he come to a seemingly contradictory finding that methane mitigation is not (or just far less) important? Zeke shows how changes in the concentration of methane and CO2 have led to changes in CO2 since 1990. But this obscures the contribution of how our emissions contribute to the warming.
So what accounts for the difference? My graph stems from how concentrations in the atmosphere react to humans’ emissions of methane differently than our emissions of CO2. A graph from Norway’s Cicero institute highlights this
CO2 remains in the atmosphere because it has very slow-acting and long-term sinks, while methane dissipates in the atmosphere quickly. What Zeke’s chart gets right is that the methane concentration in the atmosphere and its current contribution to warming are not rising nearly as fast as CO2. But that misses half the story: it ignores the question of what would happen if we stopped methane emissions.
Below are both of those scenarios—the reality of warming increases since 1990 because we emit CH4 vs. the counterfactual of warming decreases that would occur if we stopped emitting CH4—compared.
The top line looks the same as Zeke’s, but it is not the same as demonstrating the net effects of our decisions to keep emitting methane. The bottom line shows what would happen if we stopped emitting methane. The full effect would be the difference between these two lines (a positive minus a negative number is more positive—a double negative) and it’s what my graph shows.
To sum up: while methane and its resulting warming aren’t increasingly nearly as much as CO2, narrowly focusing on only this recent warming can understate the potential benefits of reducing our methane emissions. There’s a good reason why the recent IPCC report highlighted methane’s role in accelerating recent warming, and why a recent Nature editorial called for rapid cuts in emissions from its sources: ruminant animals, natural gas, waste management, rice, and more. My above graph reflects that the net effect of our actions on methane are still potentially drastic.


